News January 06, 2022
New Index Indicates Supply Chain Pressures Have Peaked
Developed by the Federal Reserve Bank of New York, the index suggests that supply line disruptions “might start to moderate somewhat going forward.”
Could the worst of global supply chain disruption be past?
Maybe, according to a new analysis by the Federal Reserve Bank of New York.
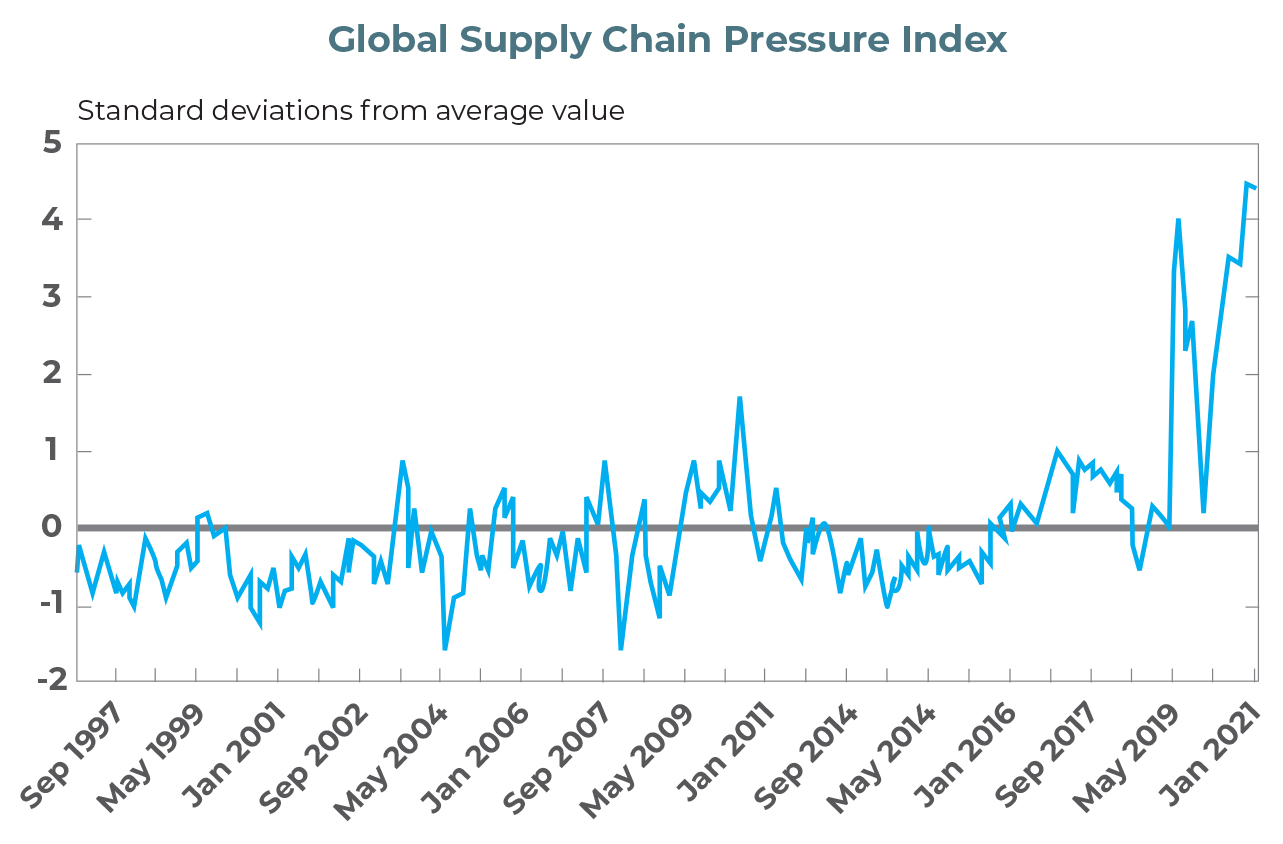
Researchers for the bank this week revealed the Global Supply Chain Pressure Index (GSCPI), a new gauge that tracks supply line disruptions back to 1997.

While the index shows that disruption levels currently remain near historical highs for that nearly 25-year period, at a rate of more than four standard deviations above average, it also indicates that the pressures have begun to ease.
“GSCPI seems to suggest that global supply chain pressures…have peaked and might start to moderate somewhat going forward,” wrote the New York Federal Reserve researchers in a blog post explaining the index.

This index on supply chain disruption, developed by the Federal Reserve Bank of New York, is scaled by its standard deviation. Sources for the index include the Bureau of Labor Statistics; Harper Petersen Holding GmbH; Baltic Exchange; IHS Markit; Institute for Supply Management; Haver Analytics; Bloomberg L.P.; and researchers’ calculations.
If true, the news would be welcomed with open arms in the promotional products industry.
Supply chain disruptions that include inadequate labor levels, factory closures, port congestion, shipping container shortages, soaring costs for importing and domestic transportation of goods, raw material shortages/rising raw material costs, and other factors have fueled inventory shortfalls, increased prices on promo products and triggered other challenges within the industry.
This short video explains the inflationary pressures driving increased prices on promo products in 2022.
The supply network issues have impacted practically all markets, disrupting the movement of goods across the globe and driving rampant inflation, with the U.S. experiencing its worst inflation in almost 40 years in November. The upheaval is rooted in fallout from the ongoing COVID-19 pandemic.
https://t.co/1FPOkJ3Ygu
— Chris Ruvo (@ChrisR_ASI) January 6, 2022
Infographic: Price increases in the #promoproducts industry are being driven by soaring costs. The stats in this handy one-page graphic put the inflationary pressures in stark relief. @ASI_MBell @asicentral @Tim_Andrews_ASI
“The GSCPI jumps at the beginning of the pandemic period, when China imposed lockdown measures,” the New York Fed researchers wrote. “The index then fell briefly as world production started to get back online around the summer of 2020, before rising at a dramatic pace during the winter of 2020 (with COVID resurgent) and the subsequent recovery period.”
There have been other times when disruption jumped notably, such as in 2011 when a tsunami struck Japan and catastrophic flooding afflicted Thailand, thereby affecting the global production chains of the auto and electronics industries, the index revealed. Still, the “spikes in the GSCPI associated with the aforementioned pale in comparison to what has been observed since the COVID-19 pandemic began,” according to the research group.
To create the index, researchers analyzed variables that typically put pressure on global supply chains.
“The first set of indicators we draw from focus on cross-border transportation costs,” researchers explained. “First, we use data on the Baltic Dry Index (BDI), which tracks the cost of shipping raw materials, such as coal or steel. Second, we exploit the Harpex index, which tracks container shipping rate changes in the charter market for eight classes of all-container ships. Finally, the U.S. Bureau of Labor Statistics (BLS) constructs price indices that measure the cost of air transportation of freight to and from the U.S., and we use the outbound and inbound air freight price indices for air transport to and from Asia and Europe.”
Another set of indicators researchers looked at focused on country-level manufacturing data from the Purchase Manager Index (PMI) surveys for nations that are substantially interlinked through global supply chains: the Euro area, China, Japan, South Korea, Taiwan, the U.K. and the U.S.
“From these PMI surveys, we use the following subcomponents of the country-specific manufacturing PMIs: ‘delivery time,’ which captures the extent to which supply chain delays in the economy impact producers — a variable that may be viewed as identifying a purely supply-side constraint; ‘backlogs,’ which quantifies the volume of orders that firms have received but have yet to either start working on or complete; and, finally, ‘purchased stocks,’ which measures the extent of inventory accumulation by firms in the economy,” the researchers continued.
In all, researchers analyzed a data set of 27 variables to estimate the GSCPI. In a forthcoming analysis, the researchers plan to quantify the impact of shocks to the GSCPI on recent movements in producer and consumer price inflation.
