Strategy May 28, 2020
Promotional Products State and Regional Sales Report – 2020
The South is king in our annual report.
Research by Nate Kucsma
The Northeast corridor of the United States – Washington D.C., Baltimore, Philadelphia, New York and Boston – is rich with political, financial and cultural history. But as the research of our exclusive State & Regional Sales Report shows, when it comes to promotional products sales revenue, the current seat of economic power is found elsewhere.
In short, the South rules.
“Based on what we’re seeing, the promo capital of America is clearly in the South – and more specifically, in Texas, Florida, the Carolinas and Georgia,” says Nate Kucsma, executive director, research and corporate marketing for ASI. “These states are growing faster than almost any other in the nation, and if you look at their cumulative economies, they make up over one-quarter of all promo sales in America.”
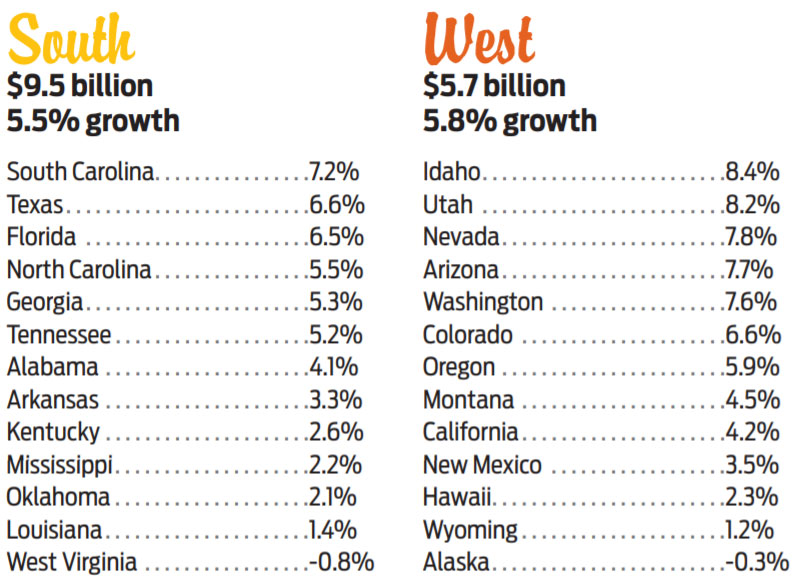
Indeed, at $9.5 billion in promo revenue, the South is at least two-thirds larger than any other region in the U.S. States like Texas ($3.4 billion), Florida ($1.5 billion) and Georgia ($1.1 billion) have something to do with that, but fast-growing promo sales in South and North Carolina as well as Tennessee reflect a region that has a dominant presence.


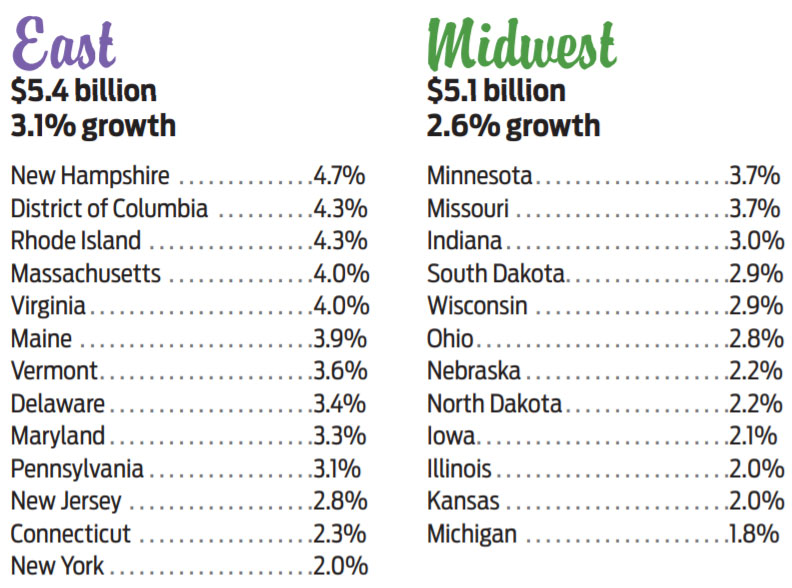
(State Promotional Products Sales Revenue Growth)
The West also can’t be ignored, thanks to 5.8% annual promo sales growth. “Yes, the California market is huge at over $2 billion a year, but it’s been growing relatively slowly over the past few years,” says Kucsma. “The economies of Idaho, Utah, Nevada, Arizona and Washington are all growing at over 7% per year. It’s true that cumulatively they trail California, but it won’t be this way for long.”
In the East and the Midwest, growth was relatively similar to last year, which means they’re still lagging behind the other regions. Both regions are dragged down by the underperformance of their largest states – New York (2%) in the East and Illinois (2%) and Michigan (1.8%) in the Midwest.
“I really believe baby boomer retirement behaviors are having a growing impact on economies within states, and therefore with promotional product spend,” Kucsma notes.
On the next page, you can view the fastest and slowest growing states for each region regarding sales of promotional products. Then check out each region’s spotlight to discover the size of every state’s promo market and a gauge of the sentiments of distributors in each region. No matter how your local market is faring, opportunity awaits.
South: Phenomenal promo growth has distributors eager to sell. Read more here!
West: Population growth and favorable business climates deliver compelling opportunities for distributors. Read more here!
East: A steady, established business climate offers plenty of optimism for the coming year. Read more here!
Midwest: Business opportunities and strengthening industries help this region shake the ‘flyover country’ moniker. Read more here!
METHODOLOGY
Revenue estimates are derived from various data, including distributor sales in each state, population trends, health of regional industries, state GDP growth, unemployment rates, census figures and other key economic indicators.


